 |
Dalton America A Family Group Project |
 |
|
Background Origin of the Daltons
at the Focus of Our Project History of Our Family Group
Project How
do I join the Dalton America project? Privacy and Sharing my DNA
Results For Y-DNA Members How do Y-DNA results tell me about my ancestors? Working with my Y-DNA Matches- Step 1: Reading my Y-DNA Matches -Step 2: Preparing my Y-DNA dashboard -Step 3: Locating your Family Subgroup -Step 4: Connecting with matches For atDNA (FF) Members How do atDNA results tell me about my ancestors? Working with my FF Matches - Step 1: Reading my FF Matches - Step 2: Preparing my FF dashboard - Step 3: Connecting with my FF cousins
Return to Dalton America Home Page |
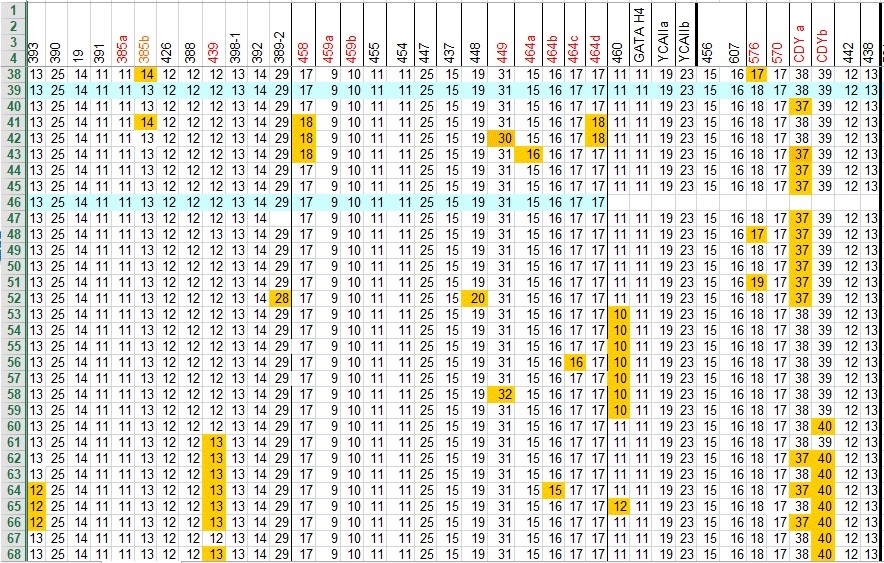
How do Y-DNA results tell me about my ancestors?What do all those numbers on the Y-STR RESULTS on my FTDNA Dashboard mean?Sometimes people have the impression that a DNA test will instantly identify their cousins, ancestors, and other relatives and array them into a family tree. It is a bit more complicated than that, but working with newly found cousins can certainly become interesting and productive. This is because the power of Y-DNA is usually not in the individual test at all, but in the accumulation of data from many individuals' tests that then can reveal family groups. In short, a list of values generated by a Y-DNA test for either 25, 37, 67, or 111 different genetic locations (markers) do not mean much in themselves. They acquire meaning when compared with the values on markers of others who can then be related to particular ancestors through genealogical research. This is why FTDNA established the family group project structure. So let's consider how one learns about ancestors through Y-DNA. Consider, for example, the following chart of marker patterns. Each column in the chart represents one particular location along human DNA (specifically the y-chromosone) where mutations from generation to generation create distinctions among families. These locations are chosen by FTDNA to maximize the power of the Y-DNA test to report where distinct families are most likely to emerge. Each row of this chart reports values on those markers for a particular family group member whose Y-DNA was tested (names of those tested, their known earliest ancestor have been left off the reproduced chart above to maintain anonymity). While the values along any particular row appear to be just meaningless numbers and seem to reveal little about the tested individual, we can clearly see in the aggregate that several of these individuals (rows 53 through 59) have a value of 10 in the column for the marker designated 460. This indicates that those submitting these samples have a common ancestor who hosted a genetic mutation in this DNA location and passed that mutation down to his descendants. We can also see that one of those descendants (row 58) hosted a genetic mutation from a value of 31 to a value of 32 on marker 449; but other descendants do not share this mutation. This indicates a mutation in a later generation than the generation leaving the common mutation on marker 460. At the same time, because the many rows of the chart (38 through 68) compare many individuals with the common surname Dalton implicated, we can see that those with that variation on 460 do not differ significantly over the full range of markers from other Daltons, but that (10 on 460) group is uniquely tied together by a particular Dalton who is their common ancestor. Having located the mutation hosted by a common ancestor, we can do two things. First, we can tell someone who carries that mutated value, perhaps you, that you probably descend from that ancestor, a genealogical fact you may not know. Second, however, we can work with those carrying that value on that marker, incorporating their documented family relationships, to identify that common ancestor and begin to build a true family tree of siblings and cousins in later generations that trace back to that original ancestor and the mutation he donated to all of them. Why should I join the Dalton America Family Group Project?The type of reasoning illustrated above is why it is helpful for those who purchase a Y-DNA test to join a family group project. Those sharing documentary data within the group expand our genealogical knowledge of their ancestors several generations earlier. Obviously the more people we have in a project the more powerful the analysis can be in providing answers to questions. In Dalton America we are fortunate to have a large number of participants and are answering more and more questions every day. Y-DNA is also an important genealogical material because it is reliable back many more generations than a second type of DNA test: autosomal DNA (abbreviated atDNA; the Family Finder test sold by FTDNA as well as the common test sold by Ancestry and the genealogy test sold by 23andMe are all AtDNA tests). Where the complexity of atDNA begins to limit the reliability of atDNA as early as the fifth generation (3nd great grandparents), Y-DNA is recognized to be reliable as far as 10 or 12 generations (8th to 10th great grandparents). This augments the power of Y-DNA to reliably fill out a family tree along the male line. In short, your active participation in the Dalton America family group project permits you to get full value for your Y-DNA test, but also maximizes what all Daltons can learn about the generations of Daltons who share the family group. Thus, you not only learn, you contribute to the power of Y-DNA research for your near and distant relatives. Why do we begin with STR results rather than SNP results?Two distinct frameworks now compete when
analyzing Y-DNA results. They are referred
to easily as “string” (STR) or “snip” (SNP)
results. At a very general level the
former are counts of sequences of DNA that
repeat at particular locations on the Y
chromosome; the latter reads the content of a
particular location on the Y chromosome.
Strings are more likely to detect mutations
within a few generations; mutations
appear in snips far less frequently
across generations. Thus the two differ on
the number and speed of mutations they identify
across generations, giving each a unique power.
Of course, our Family Group project is focused
within genealogical time: the years since
1500. An effective Y-DNA testing
program must satisfy two criteria to contribute
to our Family Group project: (1) the
generation-to-generation mutations must be
detected frequently enough to allow the sorting
of members into different family sub-groups
within genealogical time, and (2) enough
matching males must report test results to allow
the sub-groups to emerge from comparing
tests. Perhaps some day we will move beyond the focus of our current Family Group, to relate the Irish Daltons to the English Daltons, or to investigate how our members who do not seem to be matches today relate to those of us who are. At that point we may need to move to SNP tests because we will be focused on an earlier time. But for the genealogical time frame our members resources are better invested in STR tests. For a fuller explanation of STR and SNP
tests, we recommend this explanation of DNA
research by Blaine
Bettinger |
| Background |